
Introduction
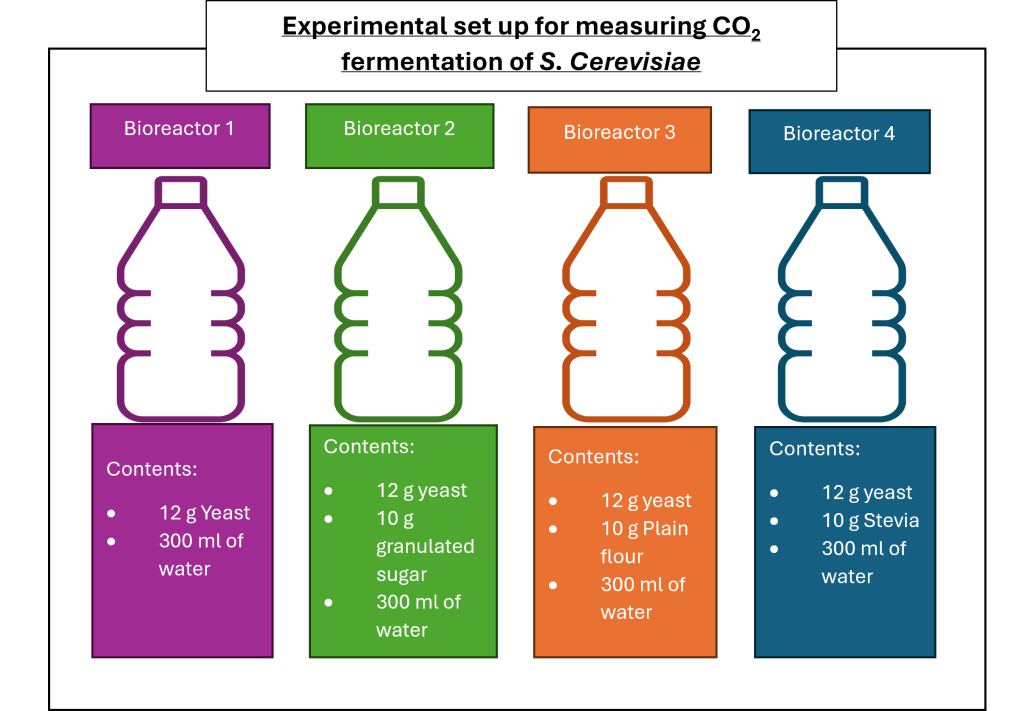
In this experiment I performed an investigation at home which measured the amount of CO2 produced by S. cerevisiae (yeast) under specified conditions. The study involved four water temperatures: 4°C, 42°C, 25°C, and 45°C, combined with three different energy sources: granulated sugar (sucrose), plain flour (starch), and stevia. A control was established using the same water temperature and S. cerevisiae, but without an energy source.
Yeast is a single-celled microorganism belonging to the fungi kingdom, existing in various environments such as soils, fruits, human oral cavities, and animal skin. To date, 1500 species have been identified (Britanica, 2025).
The yeast species, S. cerevisiae, is widely utilized in the brewing and baking industries for its fermentation process.
The fermentation of yeast produces adenosine triphosphate (ATP), the primary molecule responsible for energy transfer in living organisms. The process initiates the breakdown of the energy source such as sucrose, leading to the generation of ATP, carbon dioxide (CO2), and ethanol, see reaction below:
Sucrose + ADP → ATP + CO2 + ethanol (Reaction 1)
Researchers utilize yeast in laboratory studies because it is eukaryotic and exhibits rapid growth. While antifungal drugs have been employed to eliminate pathogens, yeasts have developed a resistance, prompting microbiologists to investigate the underlying mechanisms and seeking new strategies to eradicate these pathogens.
The purpose of this experiment is to determine the optimum conditions for producing the highest amount of CO2.
Hypotheses:
Null Hypothesis (H₀): There will be no significant difference in the production of CO2 from S. cerevisiae, irrespective of the energy source or the temperature of the water.
Alternative Hypothesis (H₁): Water temperature and energy sources affect the amount of CO₂ produced by S. cerevisiae during fermentation.
Variables:
- Independent Variables
Energy sources
– 10 g – granulated sugar (sucrose)
– 10 g – plain flour (starch)
– 10 g – stevia
Water temperatures: 4°C, 42°C, 25°C, and 45°C
2. Dependent Variable
CO₂ production measured by gas displacement (mL)
3. Control Variables:
– Mass of S. cerevisiae: 12 g
– Mass of energy source: 10 g
– Volume of water: 300 mL
– Fermentation time: 90 minutes
– Material of bottles: plastic
– Balloon type and size: standard party size (pre-stretched to ensure uniformity)
– Measurement method: Displacement of water
– Room temperature
4. Control Bottles:
The control bottles will contain 12 g of yeast and the same water temperature as experimental bottles, without an energy source.
| Researcher | Location | Weather Temperature | Yeast Brand | Stevia Brand |
|---|---|---|---|---|
| Tennille Badger | UK, England | 16 °C – 17.5 °C | Allinson’s Yeast | Pure Via Stevia |
| Mercy Stubbs | Africa, Nigeria | 22 °C | STK Royal Instant Yeast | Tropicana Slim Stevia |
Safety, Risk Assessment, and Management
Materials:
- Four well-rinsed, empty 2-litre plastic bottles (bioreactors)
- Digital or kitchen scale
- 4 teaspoons or spatula
- 4 weighing boats, small dishes or plastic measuring utensils
- Dried yeast (S.cerevisiae)
- Granulated sugar (sucrose)
- Plain flour (starch)
- Stevia (natural sweetener)
- Measuring cylinder or jug (300 mL capacity)
- Large container to hold water, if possible 1200 mL (a jug or a Tupperware)
- Thermometer
- Glass or plastic funnel
- Permanent marker (to label bioreactors)
- Labels for each bioreactor and tape to stick label to bioreactors
- Balloons, use different colours (to capture CO₂)
- Lab timer or phone (set for 90 minutes)
- Plastic bowl and baking tray (for water displacement method)
- Large funnel (for water displacement method)
- String or twist ties (to seal balloons temporarily)
- Kettle for boiling water
- Refrigerator for chilling water
- Heat-resistant gloves
- Safety goggles
- Face mask
- Kitchen towel or cloth
Experimental Design:
- Two researchers, Mercy and Tennille, will each conduct the investigation.
- Water temperatures of: 4°C, 42°C, 25°C, and 45°C will be tested.
- Energy sources: Granulated sugar (sucrose), plain flour (starch), stevia.
- Each experimental condition will be tested with a control bottle containing only yeast and water at the same temperature.
Procedure:
Step 1: Set up and preparation
- Gather all the items required for the experiment and place them on a clean work area, remove all breakables and sharp objects.
- Run a risk assessment.
- Ensure you have your camera, notepad and pen to document observations.
Step 2: Preparing the Bioreactors (Plastic Bottles)
- Place 4 plastic bottles in the work area, which have been well rinsed out.
- Label 3 of the bottles with the energy source and 1 as the control.
- Weigh 12 grams of dried yeast. Place a small bowl or container (yeast only) on the scale.
- Open one of the bioreactors, placing the funnel in the bottle opening and pour the yeast inside.
- Repeat for all bottles, including control bottles.
Step 3: Preparing the Energy Source Solutions
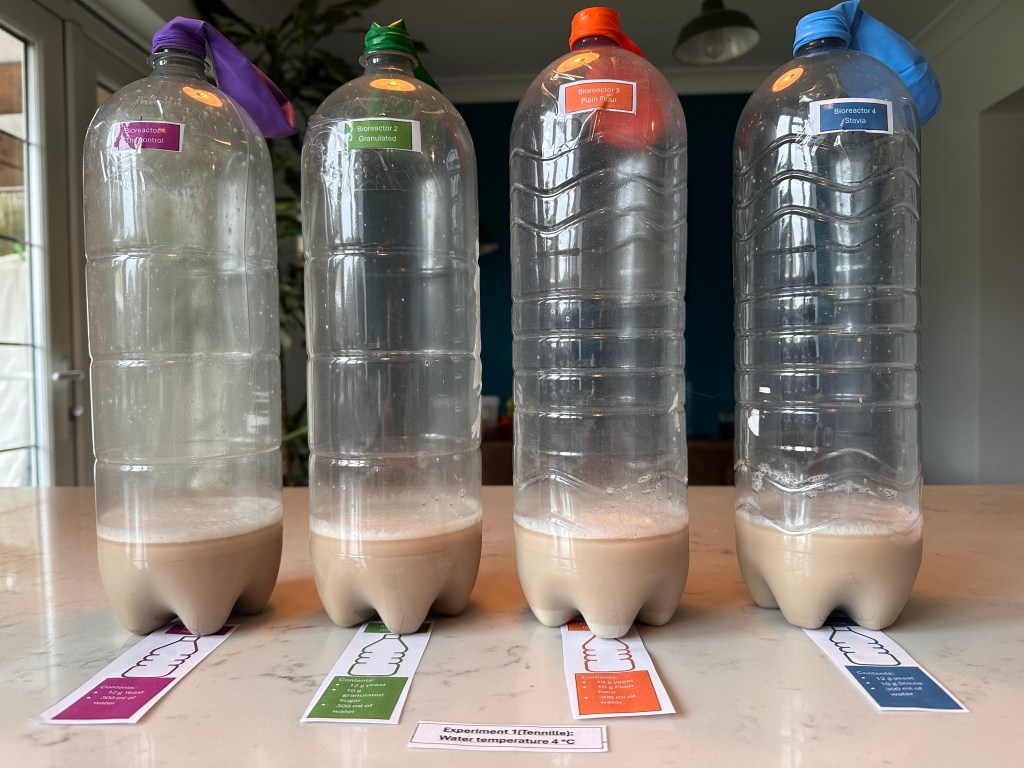
- Weigh 10 grams of each energy source and place into the labelled bioreactor:
- Granulated sugar (sucrose)
- Plain flour (starch)
- Stevia
- Use a separate bowl or container to weigh each energy source, to prevent contamination.
- Transfer the energy source into the ladled bioreactors, placing the funnel at the opening of the bottle. Make sure the funnel has no particles from the previous energy source or wash the funnel and dry before you reuse.
Step 4: Preparing and Adding Water
- Decide which water temperature you are going to measure. i.e. 42°C
- Pour water into jug that can hold at least 1200 mL of water.
- Measure the temperature in this container, add and remove water until the water temperature is within ±0.5 ˚C of the desired temperature. When the thermometer is within range.
- Use the measuring jug to measure out 300 mL of water for each bioreactor. (Do this as quickly and safely as possible, to avoid a large time gap between each bioreactor)
- Pour the measured water into each bottle, including the control bottles.
- Seal the bottle and gently swirl to mix.
- Make sure the yeast particles are mixed in and not dotted around the top of the bottle.
Step 5: Attaching the Balloons
- Remove the bottle caps and stretch a balloon over each bottle opening.
- Ensure the balloons are securely attached to capture CO₂ production. (Fermentation of S.cerevisiae)
Step 6: Fermentation Process
- Set a timer for 90 minutes.
- Place the bottles in a controlled environment and leave them undisturbed.
Step 7: Measuring CO₂ Production
Method: Water Displacement in a Bowl
- Fill a plastic bowl to the brim with water and place in a larger container or tray to catch the water.
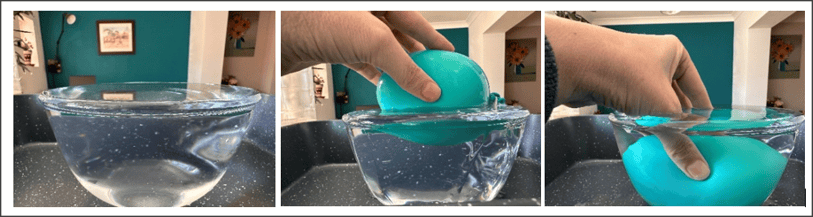
- Carefully pinch the neck of the balloon and tie the string at the top of your fingers, then remove the balloon from the bioreactor.
- Peal the balloon slowly from the bottle. Now you should have balloon containing CO2.
- Slowly submerge the balloon into the bowl of water, allowing the displaced water to overflow into the tray.
- Collect the displaced water in a measuring cylinder or jug and record the volume in mL.
- Repeat the measurement two more times for accuracy and calculate the mean value.
Step 8: Tidy up
- Once all the measurements have been taken, tidy up your work area.
- Carefully dispose the contents of each bioreactor, either in a compost bin or sealed container in general waste bin.
- Rinse each bioreactor thoroughly with water, as you will use them again.
- If any of the weigh containers or spoons have been contaminated, wash and dry them out.
Step 9: Repeat and complete
- Repeat steps 1 to 8 until all temperatures have been investigated.
- Once all temperatures have been tested and documented, dispose the contents of the bioreactors carefully, into compost or a sealed container in the waste bin.
Step 10: Observations and Data Collection
- Record qualitative observations:
- Presence of foam
- Balloon inflation levels
- Colour or texture changes in the liquid
- Record quantitative data:
- CO₂ volume using water displacement
- Compare results across different conditions
Step 11: Data Analysis
- Compare CO₂ production across energy sources and temperatures.
- Use a bar graph to identify trends.
- Evaluate inconsistencies and possible sources of error.
Step 12: Conclusion
- Determine the optimal temperature and energy source for yeast fermentation.
- Discuss implications for food processing, biofuel production, and microbiology.
- Suggest improvements for future experiment.
Results
The investigations were conducted in Africa and the UK, with Allisons yeast in the UK and STK royal instant yeast in Africa. Room temperatures in the UK ranged from 15.2 ±0.05 °C to 19 ±0.05 °C and a stable 22 °C in Africa.
All measurements of water produced an uncertainty of ±25 mL. The apparatus measured in increments of 50 mL. Refer to equation 1.
50 ml/2 = 25 mL
The temperature probe provided a range of -50 °C ~300°C, and measuring increments of 0.1 °C, thus providing an uncertainty of ±0.05 °C. The kitchen scale, measuring the energy sources, measured in increments of 1 g, proving an uncertainty of ±0.5 g.
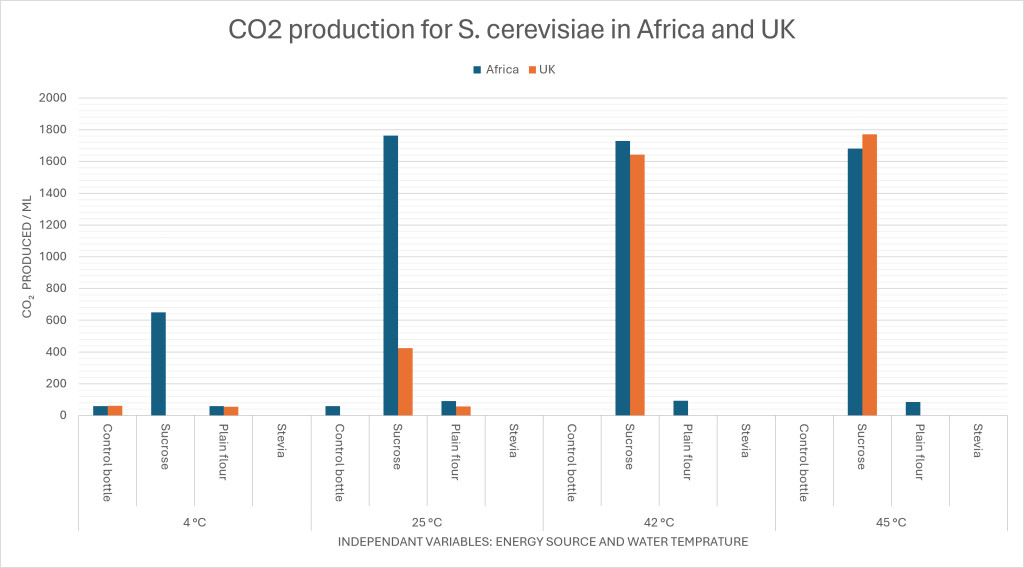
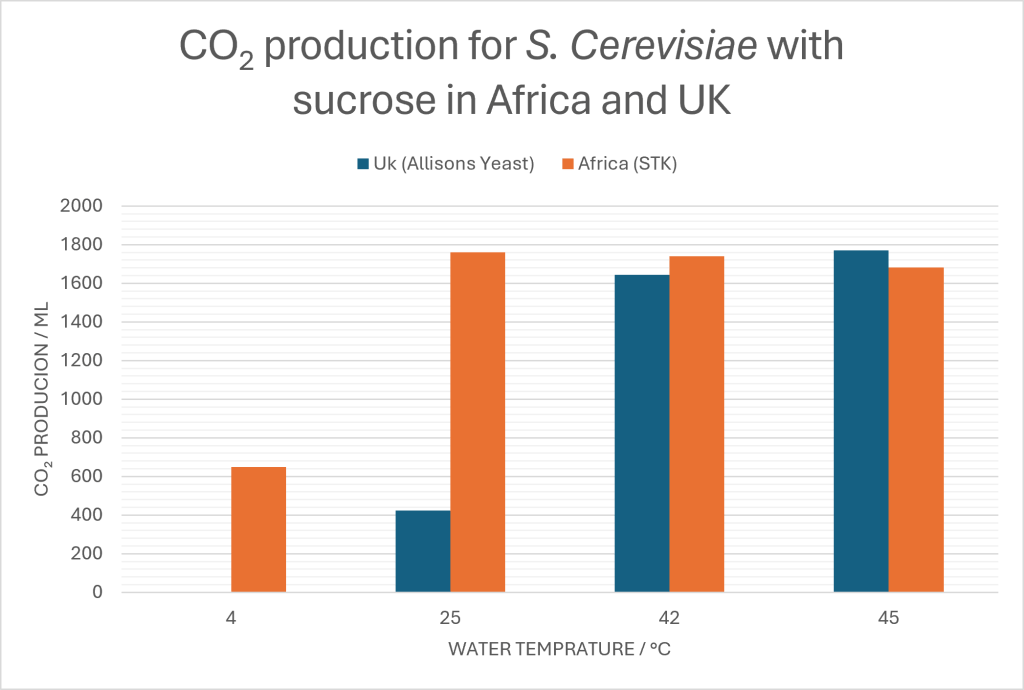
The experiments held in the UK indicated that the water temperature at 45 ±0.05 °C and the energy source sucrose of 10 g ±0.5 g, produced the highest yield of CO2, with a mean of 1771 mL ±25 mL.
Sucrose also produced a good result with the water temperature at 42 ±0.05 °C, with a mean of 1643 mL ±25 mL, which is a 7 % decrease from the highest yield at 45 ±0.05 °C.
Plain four produced 56 ±25 mL of CO2 at 4 ±0.05 °C and 25 ±0.05 °C, but nothing at 45 ±0.05 °C and 42 ±0.05 °C. Interestingly the control produced 62 ±25 mL of CO2 at 4 ±0.05 °C.
Stevia did not produce any CO2 across all four temperatures.
Overall, the energy source (in the UK) sucrose produced the most amount of CO2, at water temperatures of 45 ±0.05 °C, 42 ±0.05 °C and 25 ±0.05 °C, however at 4 ±0.05 °C no CO2 was produced.
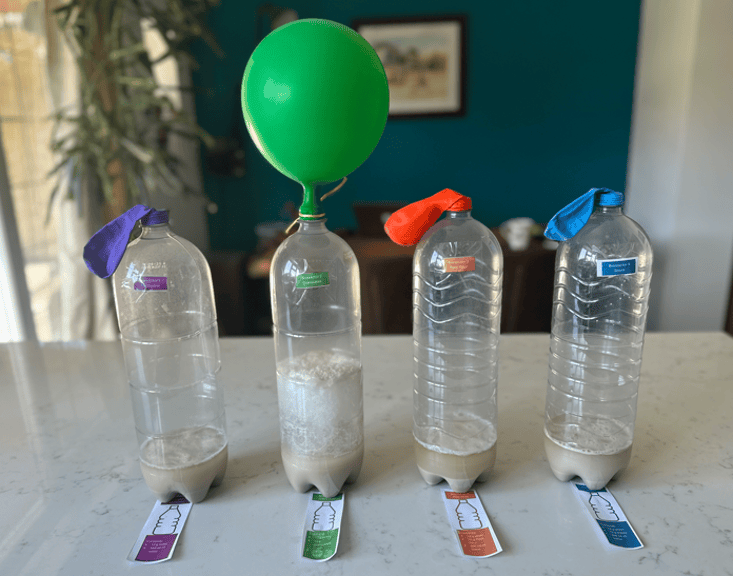
At 4 ±0.05 °C the purple control balloon and the orange plain flour balloon inflated slightly, this occurred soon after the balloons were placed on the bottles and remained this size throughout the 90 mins.
At 45 ±0.05 °C the fermentation process for sucrose is seen in figure 15. Foam has risen and the green balloon capturing CO2 is standing up right. All bioreactors formed a cloudy mixture with light brown colour. The control, plain flour and stevia formed a dark line between the liquid and layer of foam.
At 42 ±0.05 °C the bioreactor which contained stevia, formed a layer of white clumps. Plain flour at 45 ±0.05 °C settled at the bottom of the bioreactor and sucked the balloon in.
The experiments in Africa produced interesting results. Sucrose at water temperature of 25 ±0.05 °C produced the highest yield of CO2 at 1761±25 mL. The next best result was sucrose at 42 ±0.05 °C producing a CO2 yield of 1740 ±25 mL. Plain flour produced CO2 across all four temperatures. The control bottle produced 59 ±25 mL of CO2 at 4 °C and 58 ± 25 mL at 25 ± 0.05 °C. Stevia did not produce any CO2 across all four temperatures.
Discussion
Based on the results, sucrose yielded the highest production across all temperatures. However, it remains unclear which specific temperature achieved the optimal yield. Stevia yielded the lowest production, with no CO2 across all temperatures.
S. cerevisiae is a microorganism which requires certain conditions to thrive. These include:
- Warmth: Temperature between 30 °C and 37 °C (if too cold yeast becomes dormant and if too hot yeast will denature)
- Moisture: needed to activate yeast
- Energy source: Yeast needs an energy source to break down such as glucose, sucrose and fructose to produce CO2 and ethanol.
- pH: The pH needs to be slightly acidic between 4-6 pH. If too acidic or too alkaline yeast will die.
The results of this experiment don’t align with the yeast requirements and raises several questions:
- If yeast becomes dormant at low temperatures and requires an energy source to produce CO2, why did the control balloon inflate at 4 ±0.05 °C?
- Why did the bioreactor with plain flour inflate at 4 ±0.05 °C and suck the ballon in at 42 ±0.05 °C in the UK?
- If the yeast denatures at high temperatures, why did the sucrose at 45 ±0.05 °C produce a high yield of CO2 in the UK experiment?
- Why did the sucrose produce the most amount of CO2 at 25 ±0.05 °C in Africa?
To answer these questions, we need to revisit all the variables:
- Independent: Energy sources and the four water temperatures.
- Dependant: CO2 produced
- Controlled: The variables identified for control (Variables highlighted indicate partial control)
- Mass of S. cerevisiae – 12 ±0.5 g
- Batch of S. cerevisiae – UK: Allisons Yeast Africa: STK Royal instant yeast
- Mass of energy source – 10 ±0.5 g
- Amount of water in bioreactors – 300 ±25 ml
- Room temperature – UK: 15.3 ±0.05 °C to 19.4 ±0.05 °C. Africa: 22 ±0.05 °C
- Size bottle/bioreactor – 2 l
- Material of bioreactor – plastic bottle
- Duration of the fermentation period – 90 mins
- Size and/or elasticity of the balloon – standard party
- Method to determine volume of gas collected from fermentation – Displacement of water.
- Cofounding – The variables that were not controlled, but could influence the results:
- What was in the container before: if the bioreactors contained a sugar-based product prior to the experiment, there may have been some residue that influenced the fermentation.
- Pressure changes: When adding cold water (4 ±0.05 °C) to the bioreactors at room temperature, the air inside the bioreactor cooled quickly, causing a low-pressure zone, which would have pulled the balloon in and then expanded shortly afterwards. Also, at 42 ±0.05 °C the air pressure could have dropped and that’s why the balloon was sucked in, causing a cooling vacuum.
- Environmental temperatures: The counter where I performed the experiments in the UK is quartz, which is cold to the touch and a room temperature between 15.3 ±0.05 °C to 19.4 ±0.05 °C. This could have lowered the water temperature of the bioreactor at 45 ±0.05 °C. In Africa the room temperature was 22 ±0.05 °C, which could account for the highest yield at 25 ±0.05 °C.
Further improvements could include equipment with smaller incremental measurements to reduce uncertainty, conducting the experiment in a controlled environment, such as a laboratory and repeat the experiment several times. After reviewing all results, the hypothesis: There will be no significant difference in the production of CO2 from S. cerevisiae, irrespective of the energy source or the temperature of the water, can be rejected as there is evidence that sucrose and temperature does affect the production of CO2.
Conclusions
The optimum conditions for yeast, include temperatures between 30 °C and 37 °C, moisture to activate the yeast, an energy source and a pH between 4-6 pH.
The results of this study raised questions about optimum conditions and provided an interesting discussion about variables. Where some of the variables could not be controlled and potentially effected the production of CO2.
The investigations held in Africa and the UK suggested that sucrose produced the highest yield of CO2, however the optimum water temperature was not clear. Further review identified variables that could have influenced the temperature of the water.
Stevia did not produce any CO2, which makes sense as yeast needs glucose, sucrose and fructose to produce CO2 and ethanol. To reduce the uncertainties, equipment with smaller incremental measurements should be, the experiment should be conducted in a controlled environment, such as a laboratory and repeated several times.
 Badger Ecology